🧩 Chapter 16 — Clustering
Principles of clustering, k-Means algorithm (math + by-hand example), and evaluation metrics (SSE/Inertia, Silhouette, Davies–Bouldin).
1) Clustering Principles
Goal: Group data into clusters so that within-cluster points are similar and between-cluster points are dissimilar.
graph TD
    A[Unlabeled Data] --> B[Clustering Algorithm]
    B --> C[Clusters]
Similarity / Distance
Common choice for numeric data is Euclidean distance:
2) k-Means: Objective and Algorithm
2.1 Objective
Given data \(X=\{\mathbf x_i\}_{i=1}^n\), partition into \(k\) clusters with centers \( \{\boldsymbol\mu_c\}_{c=1}^k \) by minimizing:
2.2 Alternating Minimization
- Assignment step: assign each point to nearest center
\( r_{ic} = 1 \) if \( c = \arg\min_j \lVert \mathbf x_i - \boldsymbol\mu_j \rVert \), else \(0\). - Update step: update each center to the mean of its assigned points
\( \boldsymbol\mu_c = \frac{1}{|C_c|}\sum_{\mathbf x_i\in C_c}\mathbf x_i \).
Repeat until assignments stop changing or SSE converges.
  flowchart TD
      S[Start: choose k, init centers] --> A[Assign points to nearest center]
      A --> B[Update centers = mean of assigned points]
      B --> C{{Converged?}}
      C -- No --> A
      C -- Yes --> E[Return clusters + centers]
2.3 By‑hand Mini Example (2D, k=2)
Points: \( (0,0),(1,0),(0,1), (5,5),(6,5),(5,6) \).
Init centers: \( \mu_1=(0,0), \mu_2=(5,5) \).
- Assign first 3 near \( \mu_1 \), last 3 near \( \mu_2 \).
- Update: \( \mu_1=(\tfrac{1}{3},\tfrac{1}{3}), \mu_2=(\tfrac{16}{3},\tfrac{16}{3}) \).
- Reassign → unchanged ⇒ converged.
3) Evaluation Parameters & Metrics
3.1 SSE / Inertia
\( \text{SSE} \) is the within-cluster sum of squared distances. Lower is better (for fixed \(k\)).
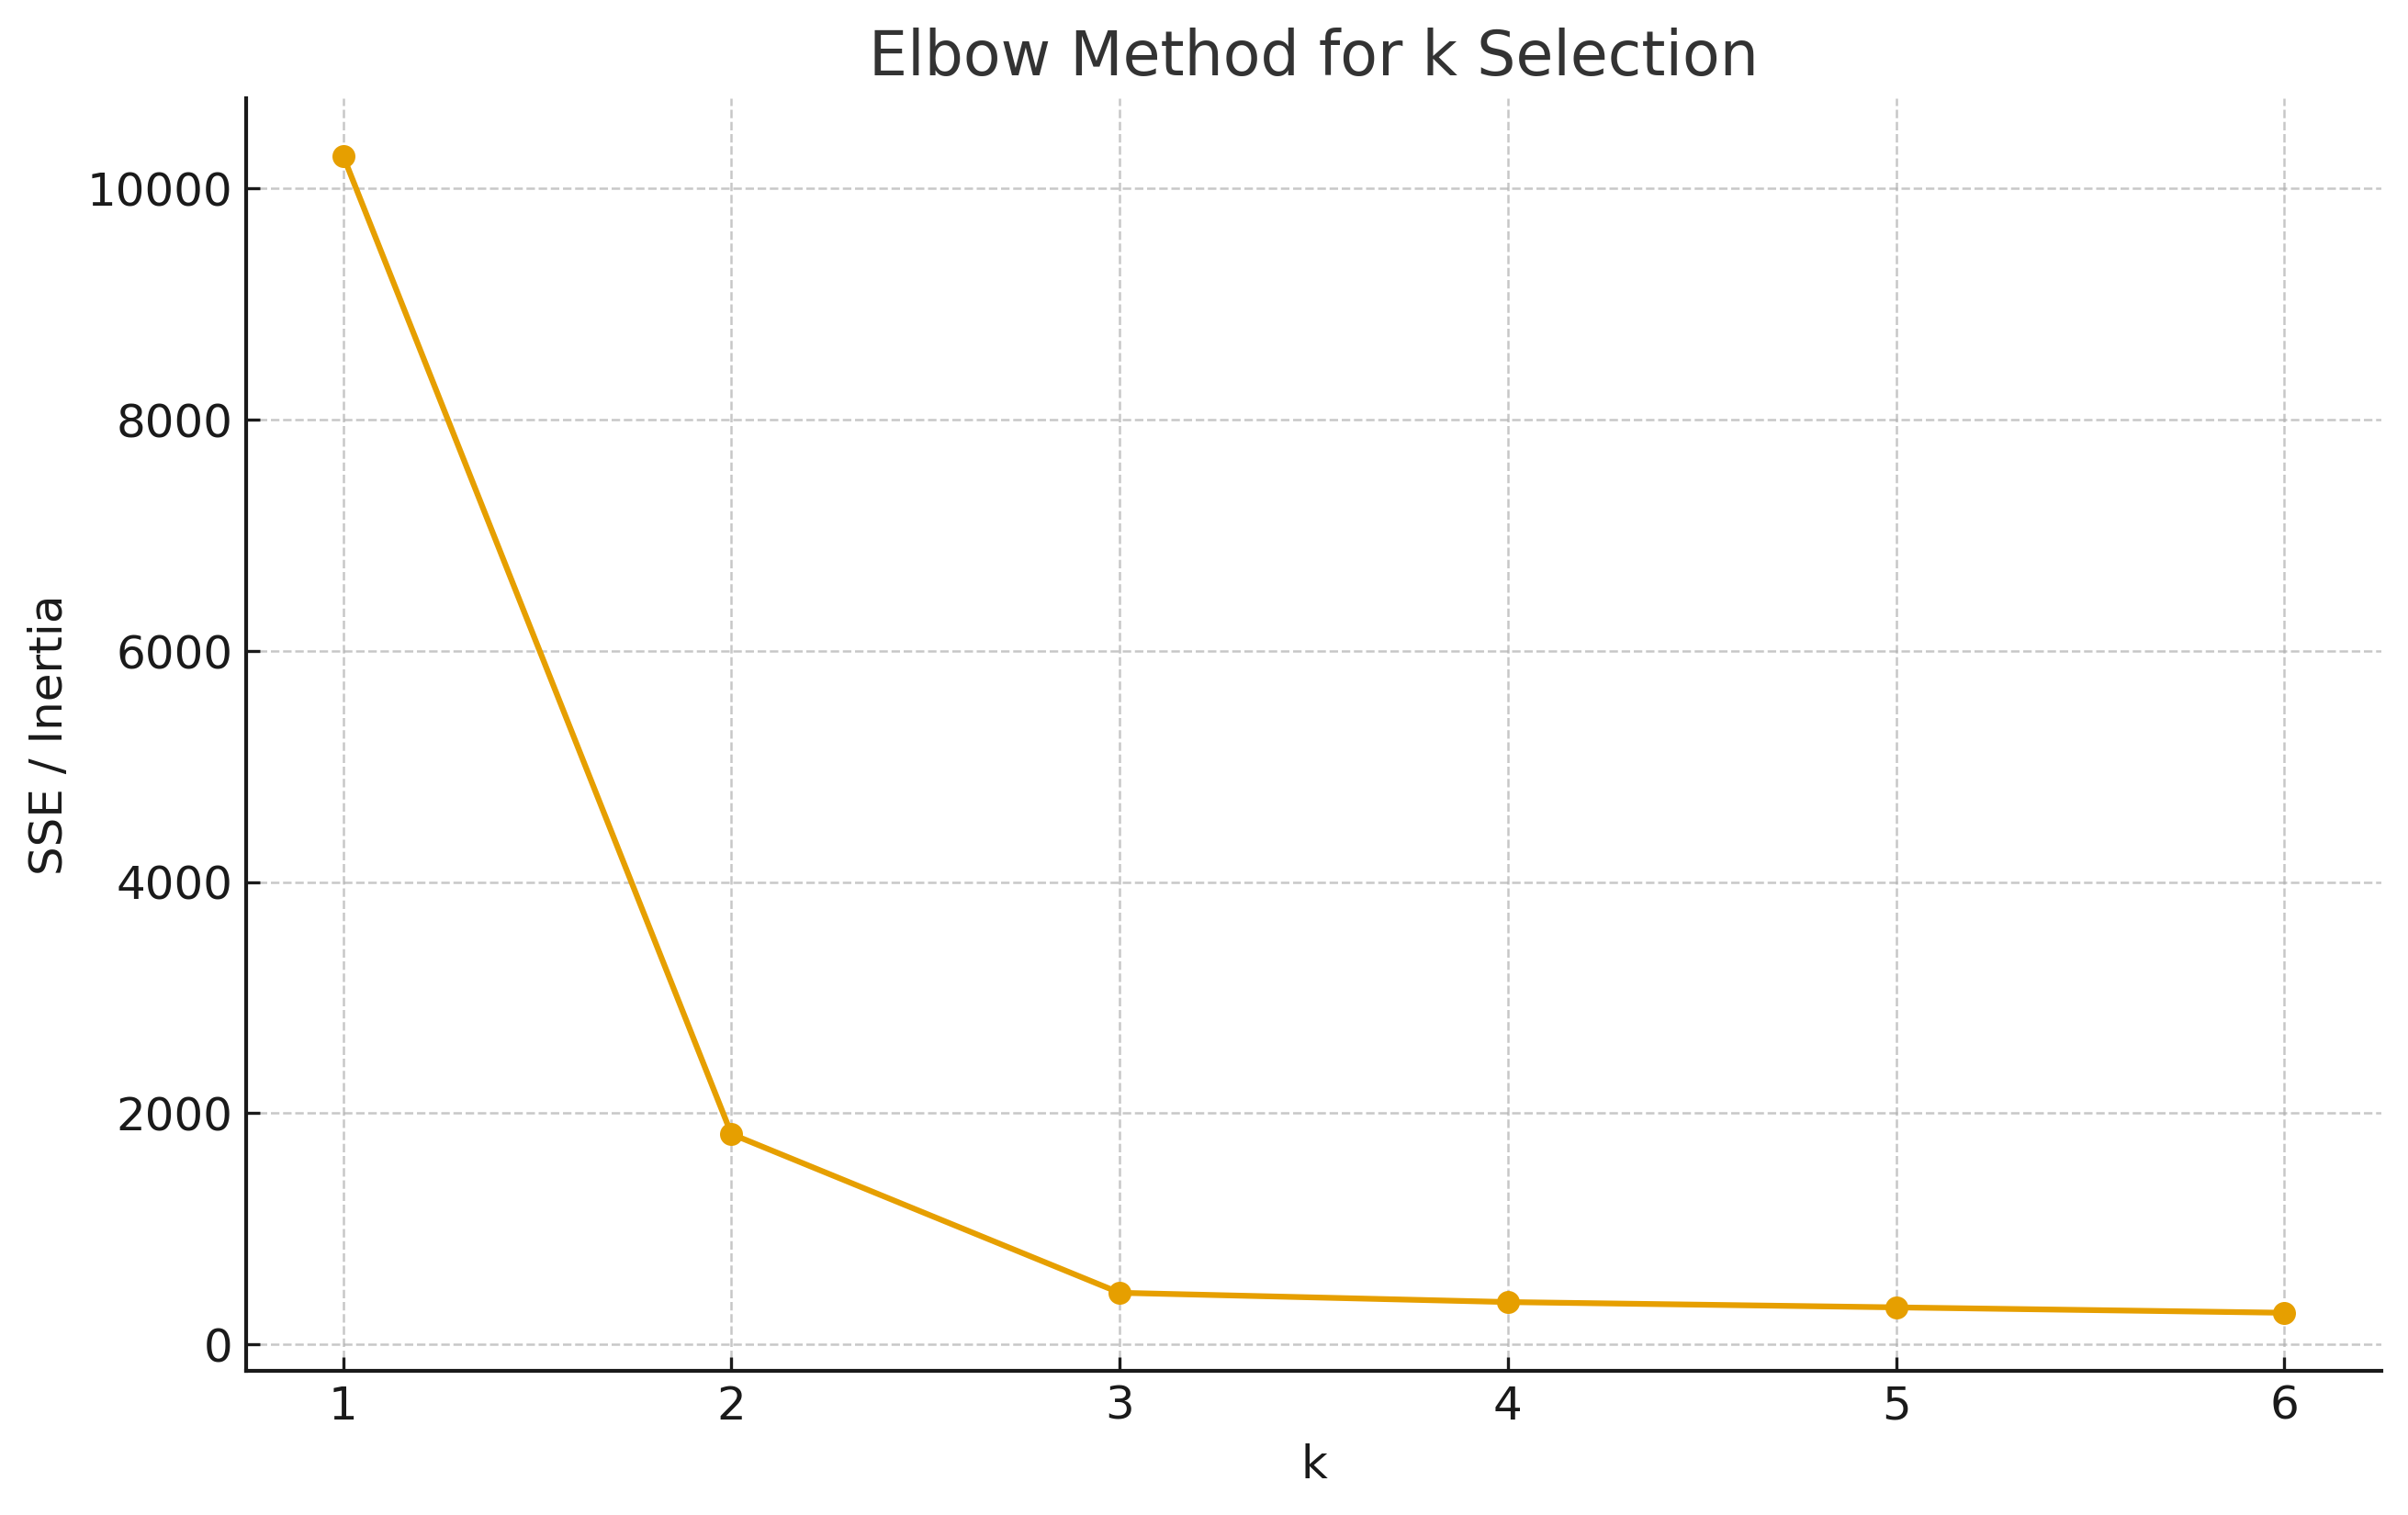
Used by the Elbow method: plot SSE vs \(k\) and look for a “knee” where marginal gain drops.
3.2 Silhouette Coefficient
For point \(i\):
\( a(i) \) = average distance to points in its own cluster;
\( b(i) \) = minimum average distance to other clusters.
Silhouette: $$ s(i)=\frac{b(i)-a(i)}{\max{a(i),\,b(i)}}\in[-1,1]. $$ Overall score is the mean \(s(i)\). Higher is better.
3.3 Davies–Bouldin (DB) Index
For cluster \(c\), let \(S_c\) be average distance of points in \(c\) to center \(\mu_c\); and \(M_{cd}=\lVert \mu_c-\mu_d\rVert\).
For each \(c\), compute \(R_{cd}=\frac{S_c+S_d}{M_{cd}}\) for \(d\ne c\), then
$$ \text{DB}=\frac{1}{k}\sum_{c=1}^k \max_{d\ne c} R_{cd}. $$ Lower DB is better (compact & well-separated clusters).
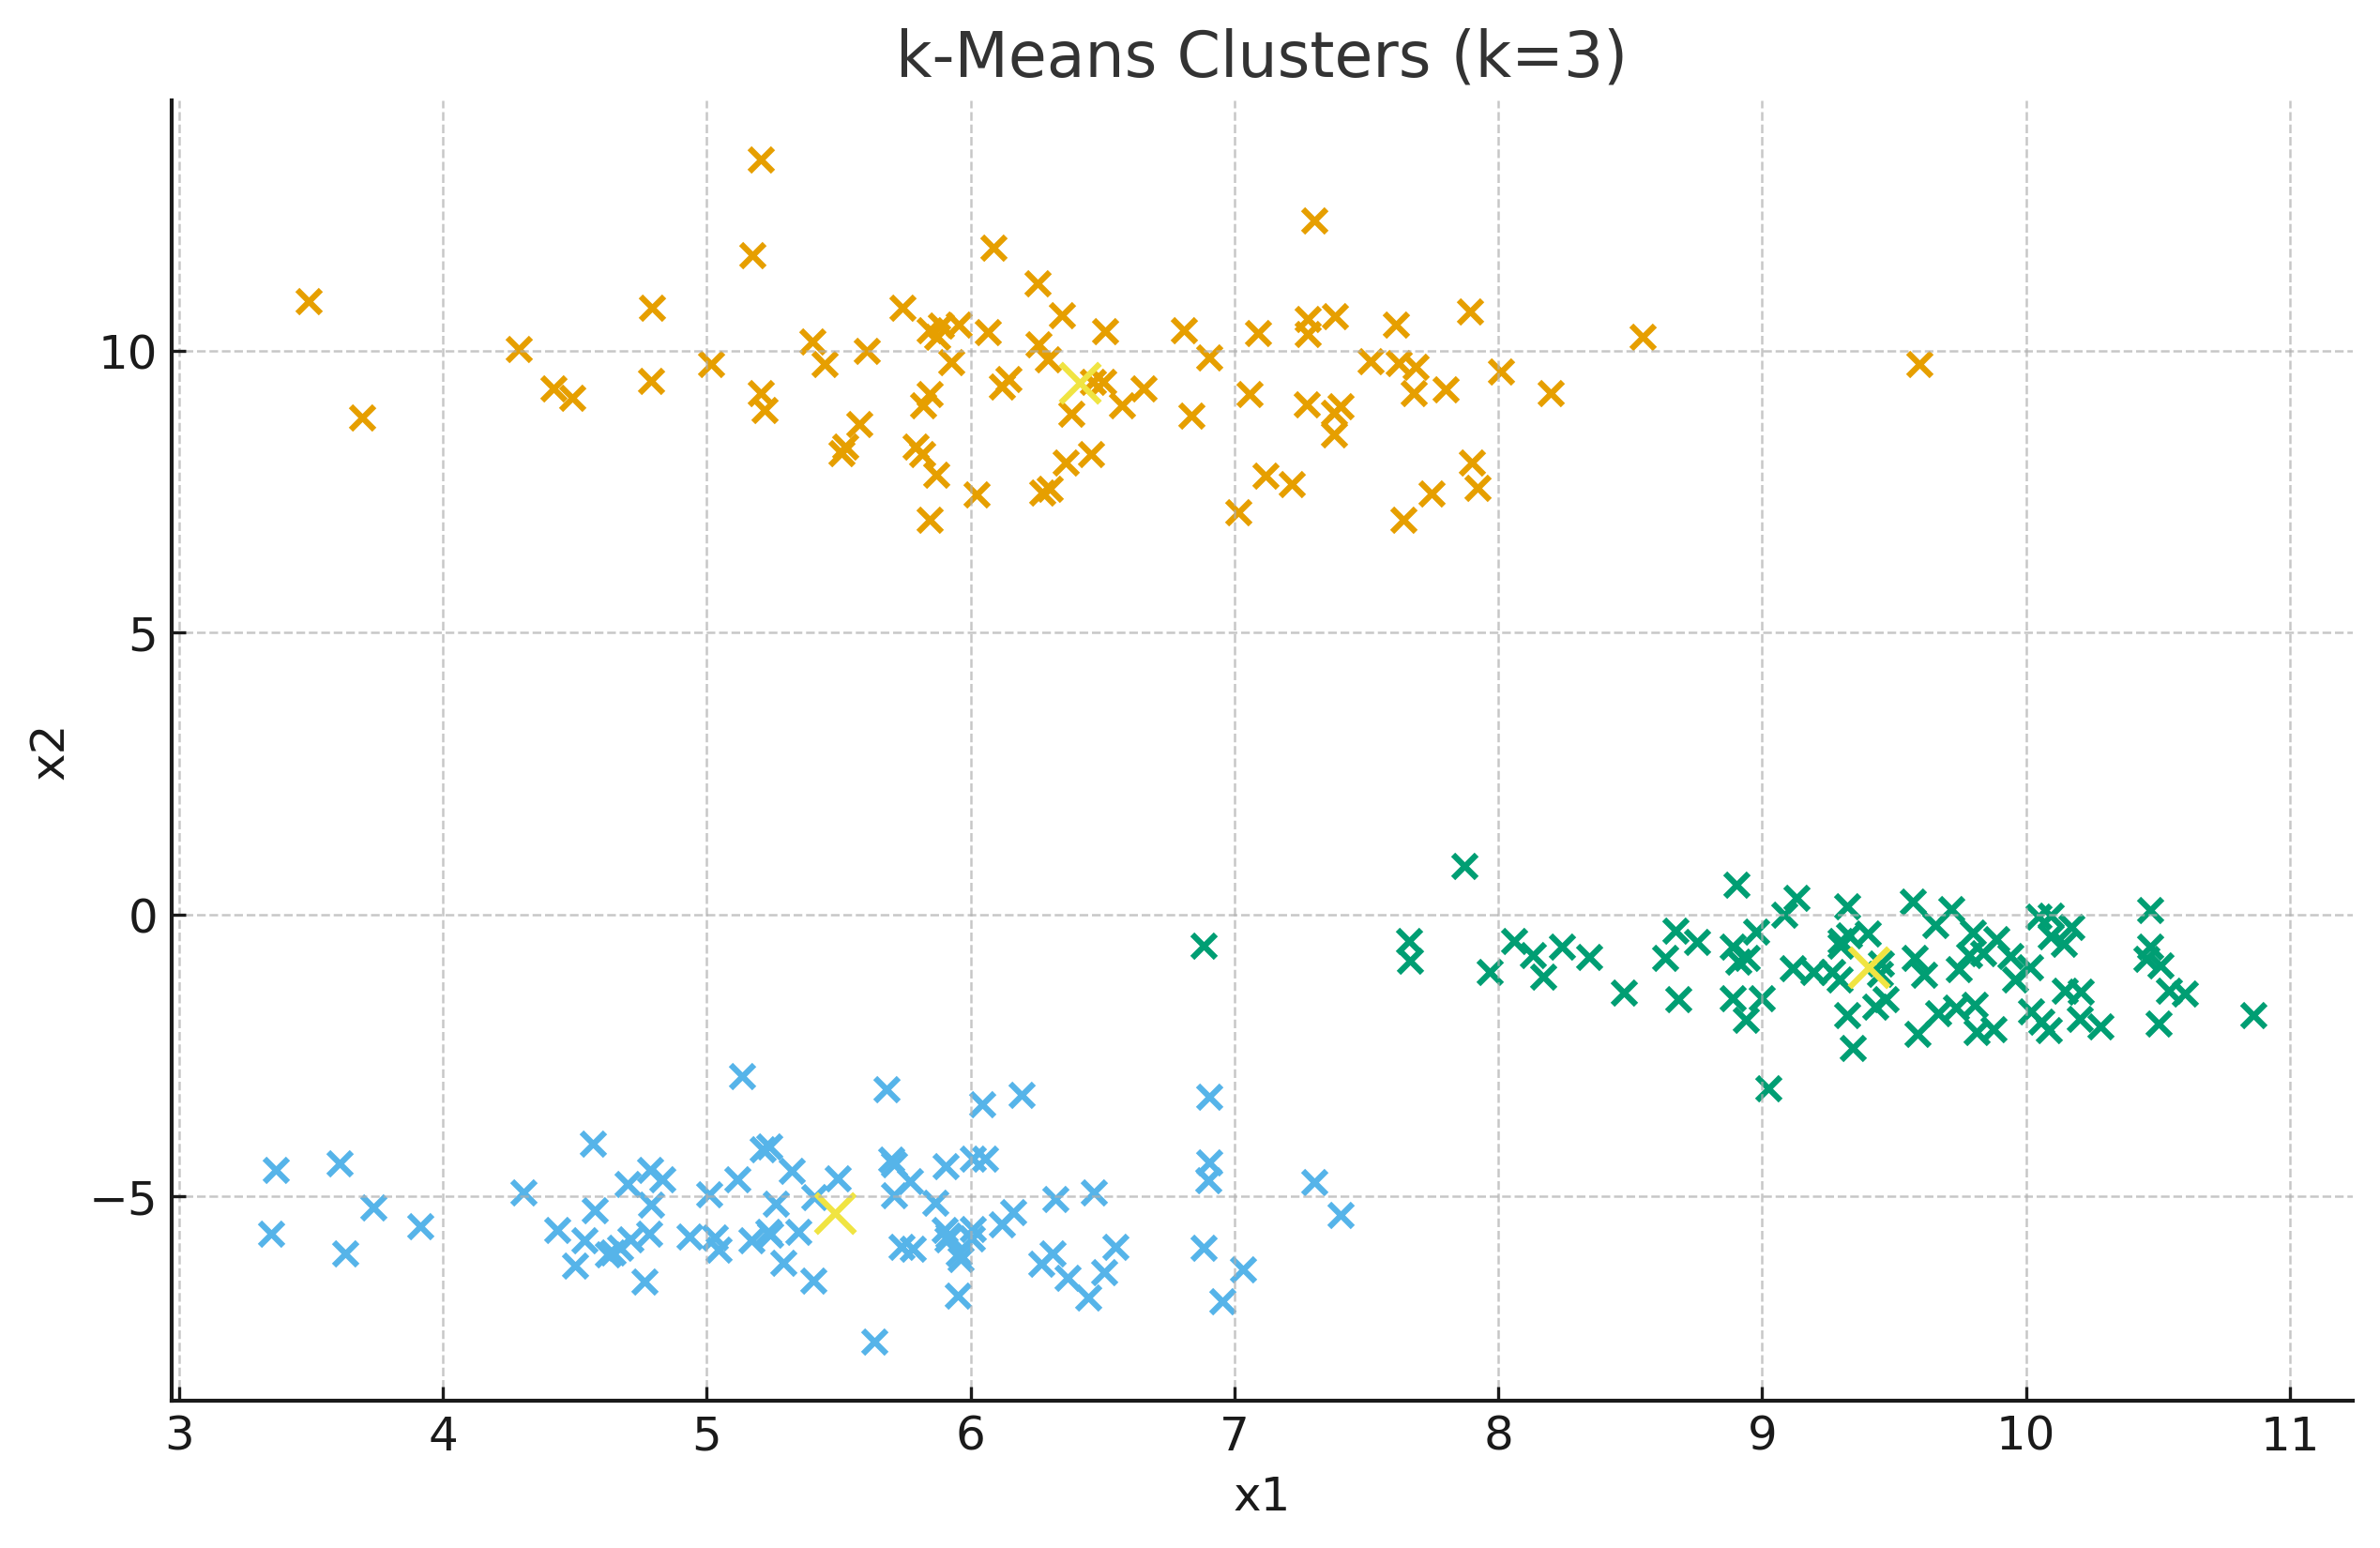
4) Visualizations (Synthetic 2‑D)
4.1 k-Means Clusters (k=3)
4.2 Elbow Method
6) Practice Questions
- Show that the k-Means center update is the mean of assigned points by minimizing SSE.
- For the by-hand two‑cluster example, compute SSE after convergence.
- Compare the effect of Euclidean vs Manhattan distance for k-Means assignments.
- Why can Silhouette be misleading for non‑convex clusters? Suggest an alternative.
- Use the Elbow and Silhouette methods together to choose \(k\).